Henry Moseley studied characteristic X-ray spectra of elements. The graph which represents his observation correctly…
Classification of Elements & Periodicity · Class 11 · JEE Main Previous Year Question
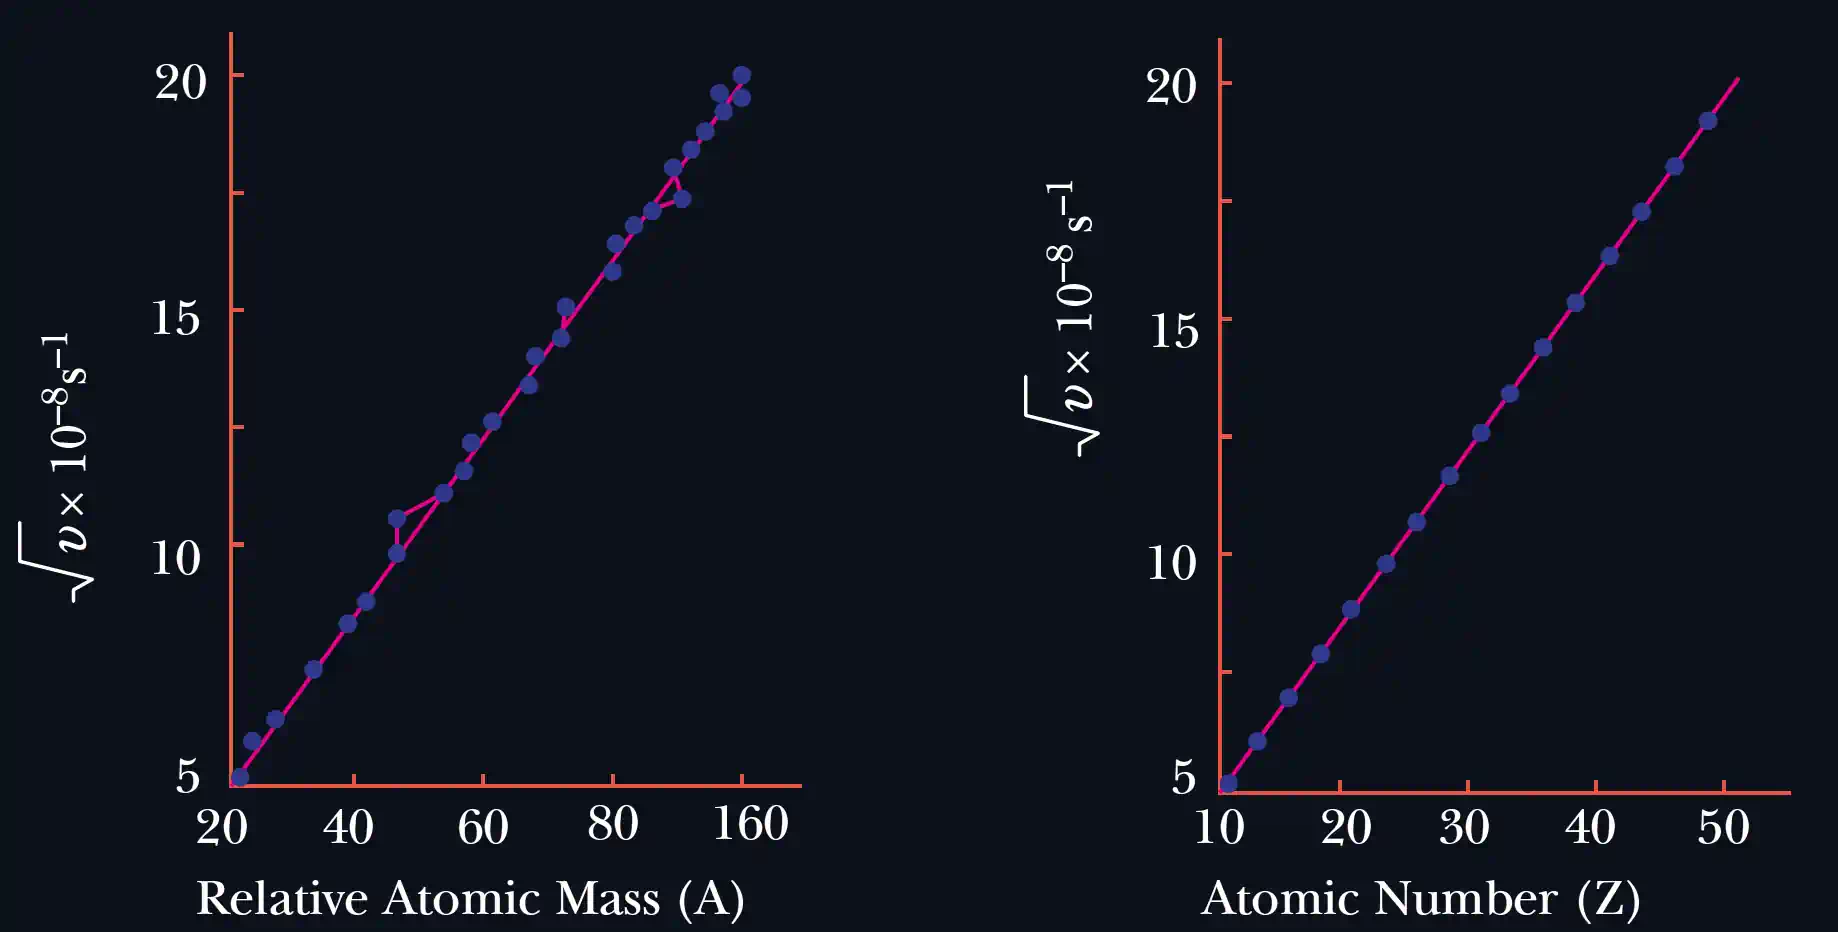
Henry Moseley studied characteristic X-ray spectra of elements. The graph which represents his observation correctly is:
(Given: = Frequency of X-ray emitted, = Atomic number)
- a
Option (1): vs — curved
- b
Option (2): vs — linear
- c✓
Option (3): vs — linear
- d
Option (4): vs — curved
Option (3): vs — linear
🧠 Moseley's law is linear in , not in
Moseley found that . Plot on the y-axis and on the x-axis — you get a straight line.
 🗺️ Read the graph
A plot of vs is curved because . Only when you take the square root does the curve straighten out. So option (3) — vs , linear — matches Moseley's equation exactly.
🗺️ Read the graph
A plot of vs is curved because . Only when you take the square root does the curve straighten out. So option (3) — vs , linear — matches Moseley's equation exactly.
⚠️ Common mistake Many students confuse the axes. Notice the y-axis is , not . A curved vs graph (option 4) would mean the law does not hold — it does.
Practice this question with progress tracking
Want timed practice with adaptive difficulty? Solve this question (and hundreds more from Classification of Elements & Periodicity) inside The Crucible, our adaptive practice platform.
More JEE Main Classification of Elements & Periodicity PYQs
Given below are two statements: Statement (I): According to the Law of Octaves, the elements were arranged in the increasing order of their atomic number. Statement (II): Meyer observed a…
Which of the following Statements are NOT true about the periodic table? A. The properties of elements are function of atomic weights. B. The properties of elements are function of atomic numbers. C.…
It is observed that characteristic X-ray spectra of elements show regularity. When frequency to the power 'n' i.e. vn of X-rays emitted is plotted against atomic number Z, the following graph (a…
Element 'E' belongs to period 4 and group 16 of the periodic table. The valence shell electron configuration of the element which is just above 'E' in the group is:
The IUPAC nomenclature of an element with electronic configuration [Rn] 5f14 6d1 7s2 is: