Velocity-Time Graphs
Slope tells acceleration, area tells displacement — one graph, two stories
Picture a city bus's day:
- For the first 10 seconds it speeds up steadily from a stop.
- Then it cruises at constant speed for 30 seconds.
- Finally it brakes hard and stops in the next 5 seconds.
If you could draw a graph of the bus's velocity over time, what would the line look like — and what would the area underneath the line tell you?
Each phase has a different shape on the graph. The area might surprise you — it is not just empty space.
The Verse on How Moments Accumulate
यथाकारी यथाचारी तथा भवति ।
साधुकारी साधुर्भवति । पापकारी पापो भवति ॥
"जैसा तू करता है, जैसे तू बर्ताव करता है — वैसा ही तू बन जाता है। अच्छा करने वाला अच्छा हो जाता है, बुरा करने वाला बुरा।"
"As one acts, as one behaves, so one becomes. The doer of good becomes good; the doer of harm, harmful. We are made by what we accumulate."
— The Upanishad's point is precise: every moment leaves a small mark, and those marks accumulate into who we are. In physics, the same arithmetic appears on this page: every instant of velocity leaves a small mark on position, and those marks accumulate into the total displacement. The area under a velocity-time graph is the universe's way of summing many small moments into a single visible total.
Why Velocity-Time Graphs Are Special
Position-time graphs hid one quantity in their slope: velocity. Velocity-time graphs hide two: their slope is acceleration, and their area beneath the line is displacement. So a single v–t graph carries enough information to fully reconstruct the motion — where the object was, how fast, and how its speed changed. This is why velocity-time graphs are the workhorse of every physics problem from this point onward.
Three shapes, three kinds of motion
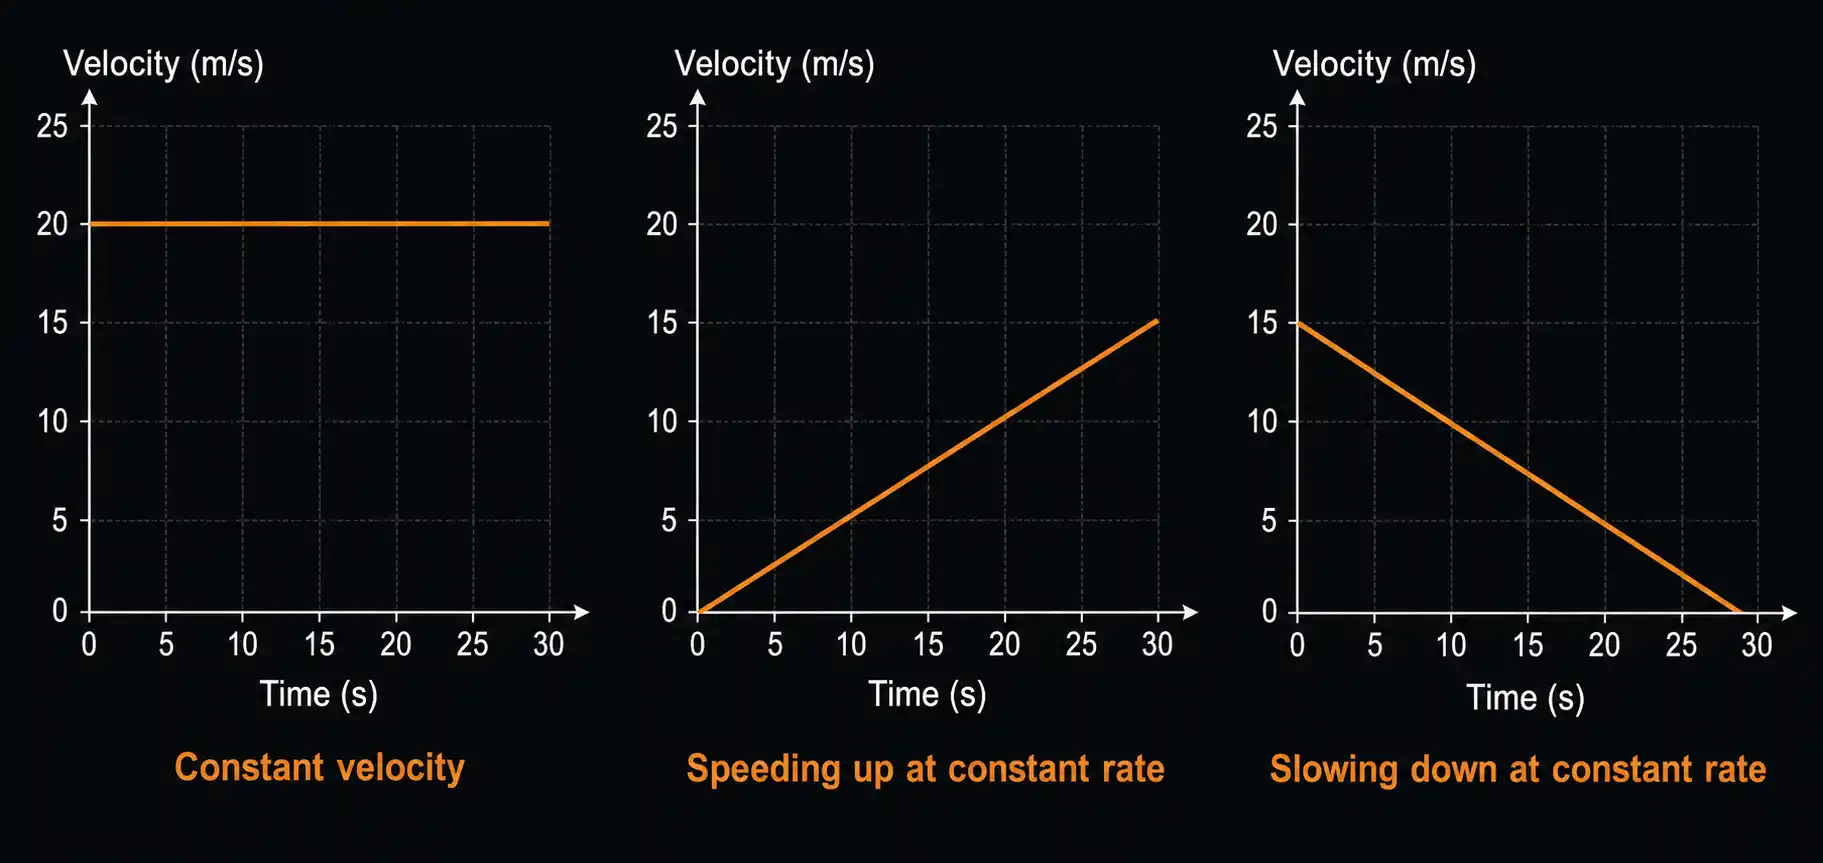
By convention, a velocity-time (v–t) graph plots time on the x-axis and velocity on the y-axis. Three shapes show up again and again — recognise them on sight.
1. Horizontal line — constant velocity (zero acceleration).
If the velocity does not change with time, every dot has the same height. The line is flat. The slope is zero — and the slope of a v–t graph is acceleration, so this means the object is not accelerating. It moves at the same speed in the same direction throughout.
2. Straight line going up — constant positive acceleration.
If the velocity grows by equal amounts in equal intervals (say, +2 m/s every second), the dots line up on a straight rising line. The slope is positive and constant. The acceleration is positive and constant — the object is speeding up steadily. A car accelerating away from a green signal, ignoring traffic, looks like this.
3. Straight line going down — constant negative acceleration.
If the velocity shrinks by equal amounts in equal intervals, the dots line up on a straight falling line. The slope is negative — the acceleration is opposite to the velocity, so the object is slowing down. A car braking smoothly to a stop looks like this. The line crosses the x-axis when velocity reaches zero — that is the moment the object stops.
Caution. A negative slope on a v–t graph does not always mean the object is going backward — it might just be slowing forward. Read the velocity values themselves, not just the slope direction.
Slope of the v–t graph = acceleration
On a position-time graph, slope was velocity. On a velocity-time graph, slope is acceleration. The same triangle trick works:
Pick two points on the line — call them at time and at time . Drop a horizontal line from and a vertical line from to form a right triangle. The vertical leg is (change in velocity), and the horizontal leg is (time interval). The ratio is the acceleration.
Example. Suppose a v–t graph shows velocity rising from at to at . The slope is
The positive sign means the acceleration is in the same direction as velocity — the object is speeding up.
For the slowing-down case — say velocity falls from at s to at s — the same formula gives . The minus sign tells you the acceleration is opposite to the velocity, so the object is slowing down.
A horizontal v–t line has zero slope — zero acceleration — constant velocity. Three shapes, one tool.
Area under the v–t graph = displacement
Now for the second hidden quantity — the one that surprises everyone. The area enclosed between the v–t line and the time axis equals the displacement of the object during that time interval.
Why this works (the constant-velocity case). Imagine a car moves at constant velocity for . Its v–t graph is a horizontal line at , stretching from to . The shape under the line is a rectangle of height and width . Its area is
But the units of this area are (m/s) × (s) = m. So the "area" actually measures 120 metres — and that is exactly the distance the car covers in 6 seconds at 20 m/s. The geometry of the graph is doing the displacement calculation for you.
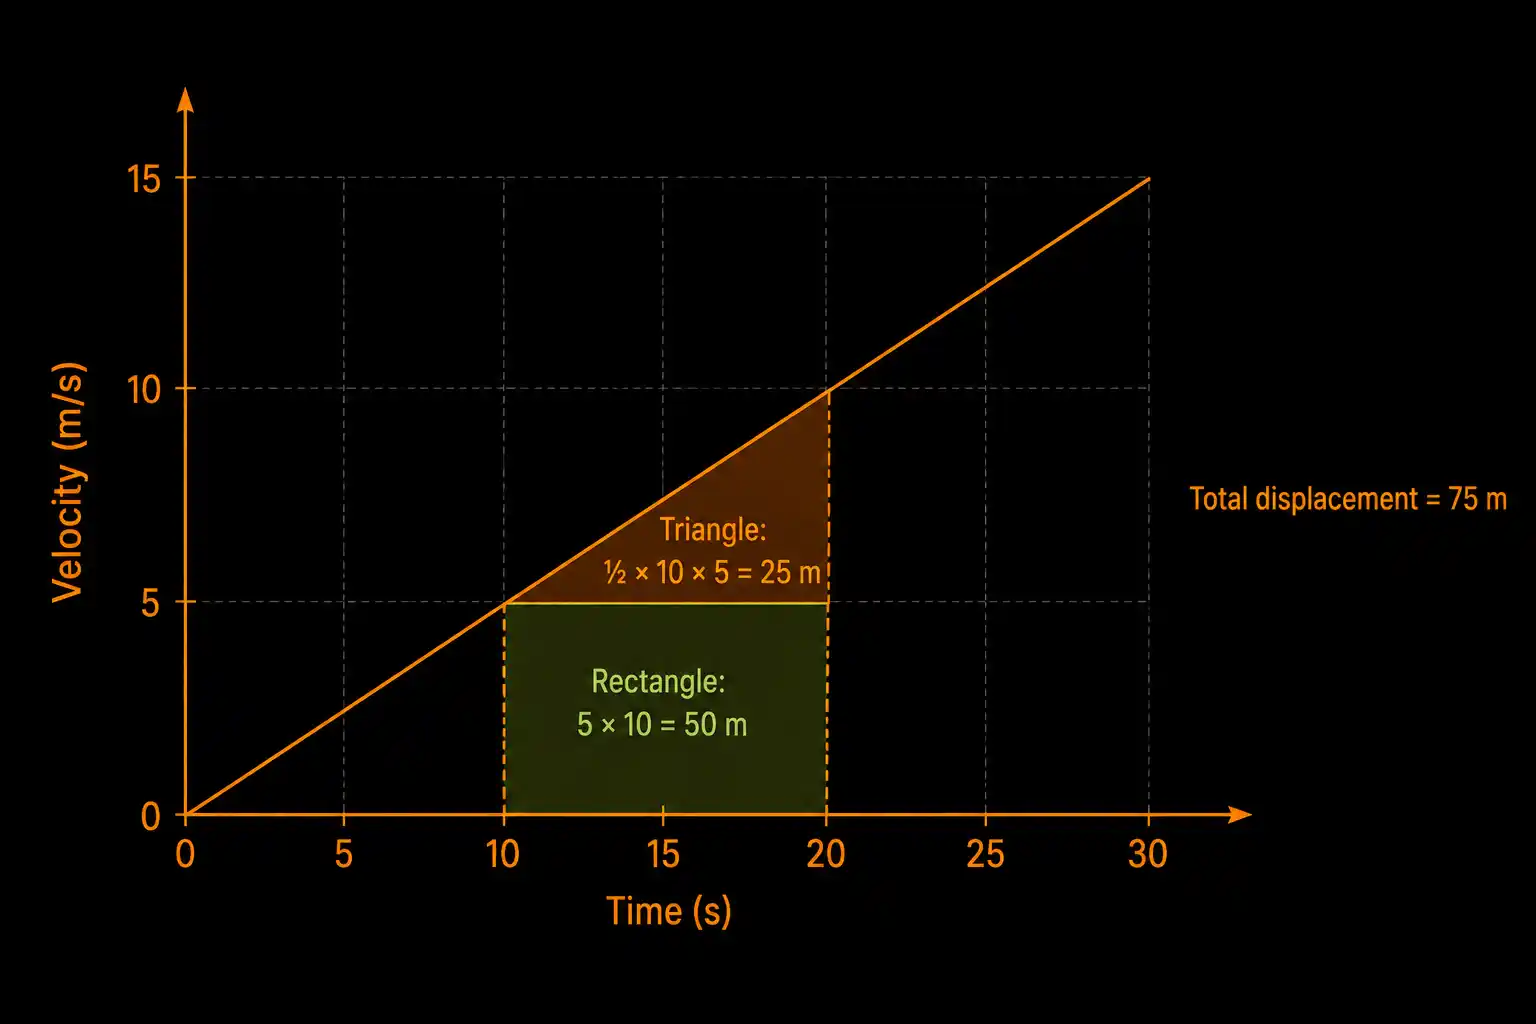
The constant-acceleration case. Now suppose a car starts from rest and speeds up uniformly. The v–t graph is a straight line from the origin upward. Suppose at , the velocity is , and at , the velocity is . The shape between and is a trapezium — and we can split it cleverly into a rectangle plus a triangle:
- Rectangle of height 5 m/s and width 10 s → area = m
- Triangle of base 10 s and height m/s → area = m
Total displacement = .
This trick — split the area into rectangles and triangles — works for any v–t graph made of straight lines. The shape under the curve carries the entire story of how far the object went, packed into one number.
A car's velocity-time graph is a straight line that passes through the points and , where time is in seconds and velocity is in m/s. Find: (a) the car's acceleration, and (b) the displacement during the first 6 seconds.
Loading simulator…
Two cars, P and Q, start at the same place at . Their velocity-time graphs are both straight lines starting from the origin. Car P's line is steeper than car Q's line.
After the same amount of time :
Threads of Curiosity — Why "Area Under a Graph" Is the Beginning of Calculus
The trick of computing displacement by adding up the area under a velocity-time graph is one of the most beautiful ideas in all of mathematics. It is the seed of integral calculus — the branch of mathematics that lets you calculate areas under any curve, no matter how strange the shape.
Q1.On a velocity-time graph, what does a horizontal straight line indicate about the object's motion?
Picture a city bus's day:
- For the first 10 seconds it speeds up steadily from a stop.
- Then it cruises at constant speed for 30 seconds.
- Finally it brakes hard and stops in the next 5 seconds.
If you could draw a graph of the bus's velocity over time, what would the line look like — and what would the area underneath the line tell you?
Each phase has a different shape on the graph. The area might surprise you — it is not just empty space.
The Verse on How Moments Accumulate
यथाकारी यथाचारी तथा भवति ।
साधुकारी साधुर्भवति । पापकारी पापो भवति ॥
"जैसा तू करता है, जैसे तू बर्ताव करता है — वैसा ही तू बन जाता है। अच्छा करने वाला अच्छा हो जाता है, बुरा करने वाला बुरा।"
"As one acts, as one behaves, so one becomes. The doer of good becomes good; the doer of harm, harmful. We are made by what we accumulate."
— The Upanishad's point is precise: every moment leaves a small mark, and those marks accumulate into who we are. In physics, the same arithmetic appears on this page: every instant of velocity leaves a small mark on position, and those marks accumulate into the total displacement. The area under a velocity-time graph is the universe's way of summing many small moments into a single visible total.
Why Velocity-Time Graphs Are Special
Position-time graphs hid one quantity in their slope: velocity. Velocity-time graphs hide two: their slope is acceleration, and their area beneath the line is displacement. So a single v–t graph carries enough information to fully reconstruct the motion — where the object was, how fast, and how its speed changed. This is why velocity-time graphs are the workhorse of every physics problem from this point onward.
Three shapes, three kinds of motion
By convention, a velocity-time (v–t) graph plots time on the x-axis and velocity on the y-axis. Three shapes show up again and again — recognise them on sight.
1. Horizontal line — constant velocity (zero acceleration).
If the velocity does not change with time, every dot has the same height. The line is flat. The slope is zero — and the slope of a v–t graph is acceleration, so this means the object is not accelerating. It moves at the same speed in the same direction throughout.
2. Straight line going up — constant positive acceleration.
If the velocity grows by equal amounts in equal intervals (say, +2 m/s every second), the dots line up on a straight rising line. The slope is positive and constant. The acceleration is positive and constant — the object is speeding up steadily. A car accelerating away from a green signal, ignoring traffic, looks like this.
3. Straight line going down — constant negative acceleration.
If the velocity shrinks by equal amounts in equal intervals, the dots line up on a straight falling line. The slope is negative — the acceleration is opposite to the velocity, so the object is slowing down. A car braking smoothly to a stop looks like this. The line crosses the x-axis when velocity reaches zero — that is the moment the object stops.
Caution. A negative slope on a v–t graph does not always mean the object is going backward — it might just be slowing forward. Read the velocity values themselves, not just the slope direction.
Slope of the v–t graph = acceleration
On a position-time graph, slope was velocity. On a velocity-time graph, slope is acceleration. The same triangle trick works:
Pick two points on the line — call them at time and at time . Drop a horizontal line from and a vertical line from to form a right triangle. The vertical leg is (change in velocity), and the horizontal leg is (time interval). The ratio is the acceleration.
Example. Suppose a v–t graph shows velocity rising from at to at . The slope is
The positive sign means the acceleration is in the same direction as velocity — the object is speeding up.
For the slowing-down case — say velocity falls from at s to at s — the same formula gives . The minus sign tells you the acceleration is opposite to the velocity, so the object is slowing down.
A horizontal v–t line has zero slope — zero acceleration — constant velocity. Three shapes, one tool.
Area under the v–t graph = displacement
Now for the second hidden quantity — the one that surprises everyone. The area enclosed between the v–t line and the time axis equals the displacement of the object during that time interval.
Why this works (the constant-velocity case). Imagine a car moves at constant velocity for . Its v–t graph is a horizontal line at , stretching from to . The shape under the line is a rectangle of height and width . Its area is
But the units of this area are (m/s) × (s) = m. So the "area" actually measures 120 metres — and that is exactly the distance the car covers in 6 seconds at 20 m/s. The geometry of the graph is doing the displacement calculation for you.
The constant-acceleration case. Now suppose a car starts from rest and speeds up uniformly. The v–t graph is a straight line from the origin upward. Suppose at , the velocity is , and at , the velocity is . The shape between and is a trapezium — and we can split it cleverly into a rectangle plus a triangle:
- Rectangle of height 5 m/s and width 10 s → area = m
- Triangle of base 10 s and height m/s → area = m
Total displacement = .
This trick — split the area into rectangles and triangles — works for any v–t graph made of straight lines. The shape under the curve carries the entire story of how far the object went, packed into one number.
A car's velocity-time graph is a straight line that passes through the points and , where time is in seconds and velocity is in m/s. Find: (a) the car's acceleration, and (b) the displacement during the first 6 seconds.
Loading simulator…
Two cars, P and Q, start at the same place at . Their velocity-time graphs are both straight lines starting from the origin. Car P's line is steeper than car Q's line.
After the same amount of time :
Threads of Curiosity — Why "Area Under a Graph" Is the Beginning of Calculus
The trick of computing displacement by adding up the area under a velocity-time graph is one of the most beautiful ideas in all of mathematics. It is the seed of integral calculus — the branch of mathematics that lets you calculate areas under any curve, no matter how strange the shape.
Q1.On a velocity-time graph, what does a horizontal straight line indicate about the object's motion?