Solubility and Temperature
Reading and interpreting graphs
What is Solubility?
Solubility is the maximum amount of solute that can dissolve in a given amount of solvent at a specific temperature to form a saturated solution.
Units: g per 100 g of water (at a specified temperature)
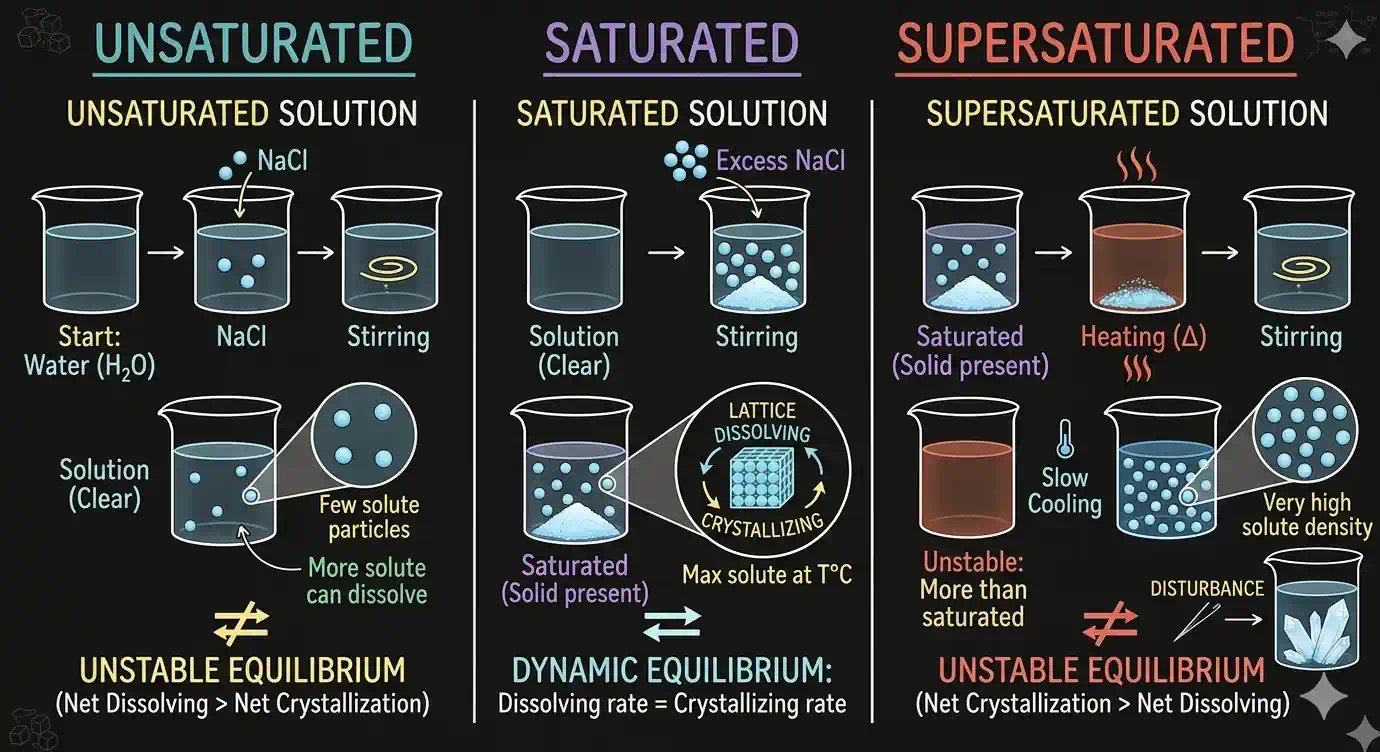
- Unsaturated: Can dissolve more solute
- Saturated: Maximum amount already dissolved — adding more won't dissolve
- Supersaturated: Contains more solute than the saturated level (unstable — achieved by slow cooling)
How temperature affects solubility:
For solids in water: Solubility generally increases with temperature. Potassium nitrate () solubility goes from ~13 g/100 g at 0 °C to ~247 g/100 g at 100 °C — a 19× increase.
For gases in water: Solubility decreases with temperature. CO₂ is 0.169 g/100 g at 0 °C but only 0.058 g/100 g at 40 °C. This is why:
- Warm soda loses its fizz quickly
- Dissolved oxygen in rivers decreases in summer — harming fish
- Carbonated drinks are kept cold
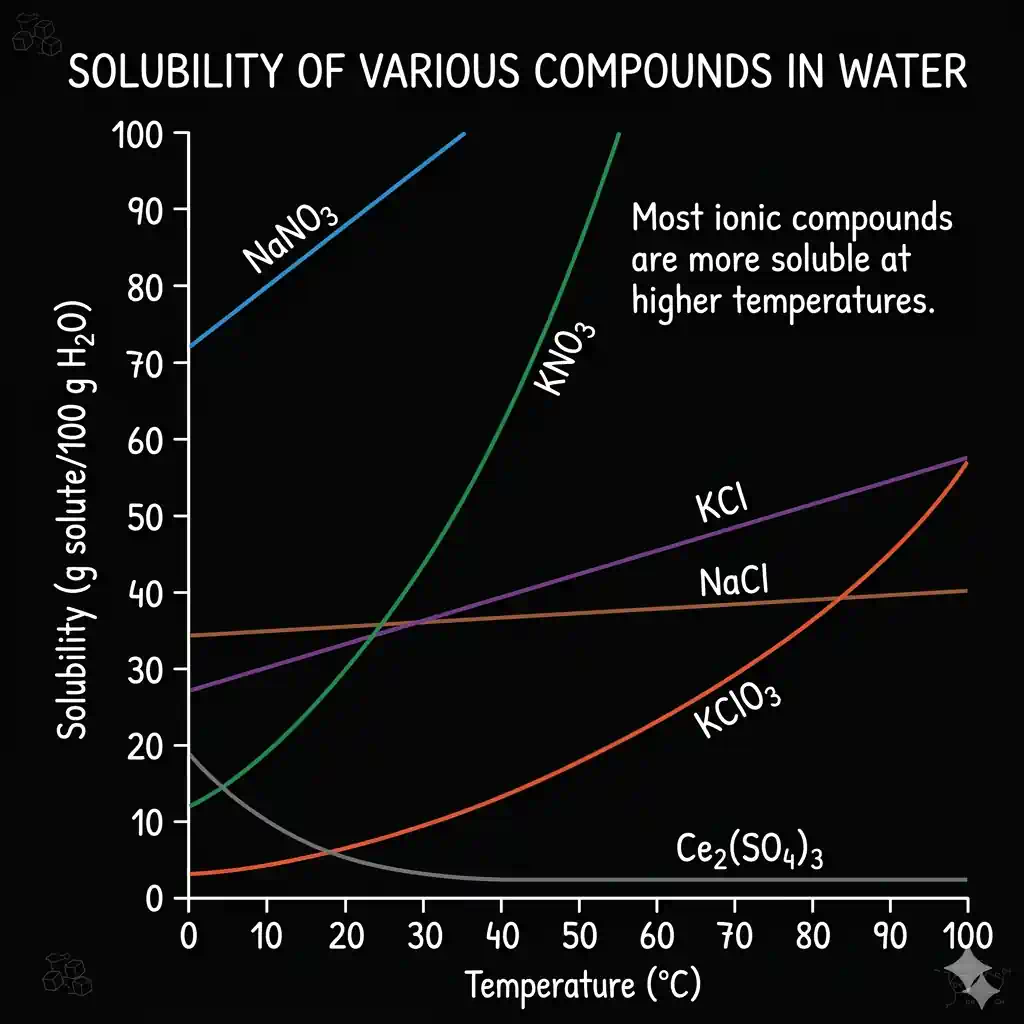
Activity 5.2 — Reading a Solubility Curve
Imagine two unknown solids — call them compound A and compound B. We dissolve each in water at different temperatures and plot the results. The graph above is exactly that — a solubility curve. The x-axis shows the temperature in °C, and the y-axis shows how many grams of the solid can dissolve in 100 g of water at that temperature.
Now look closely at the two lines.
- Compound A has a line that rises only a little as temperature goes up. From cold water to hot water, its solubility barely changes.
- Compound B has a line that climbs steeply. In cold water it dissolves only a little, but in hot water it dissolves a lot more.
What does this tell us? Different substances respond very differently to temperature. Some are not too bothered — A keeps a similar solubility throughout. Others, like B, are extremely sensitive — heat opens the door, cold slams it shut. This single idea is going to be the basis of one of the cleanest separation techniques in chemistry, called crystallisation, which you will meet on the very next page.
Where You See This Every Day
Solubility and temperature interact in ways that shape industries and everyday experience:
- Carbonated Drinks Go Flat in Summer — CO₂ dissolves in cold water under pressure. When the bottle warms up (or is opened), CO₂ becomes less soluble and escapes as bubbles. Refrigerated drinks stay fizzy longer.
- Rock Candy (Misri) — Made by creating a supersaturated sugar solution (dissolve maximum sugar in very hot water), then cooling it slowly around a string. Sugar crystallises out as it becomes less soluble at lower temperature. This is crystallisation driven by solubility change.
- Fish Kills in Summer — Fish breathe dissolved oxygen (O₂). In warm summer water, O₂ solubility drops. Shallow ponds and lakes can become hypoxic, causing mass fish death — an environmental consequence of the gas solubility-temperature relationship.
- Stalactites and Stalagmites — CaCO₃ (limestone) is slightly more soluble in cold, CO₂-rich water. As groundwater loses CO₂ in cave air, CaCO₃ becomes supersaturated and precipitates, forming stalactites over thousands of years.
What is Solubility?
Solubility is the maximum amount of solute that can dissolve in a given amount of solvent at a specific temperature to form a saturated solution.
Units: g per 100 g of water (at a specified temperature)
- Unsaturated: Can dissolve more solute
- Saturated: Maximum amount already dissolved — adding more won't dissolve
- Supersaturated: Contains more solute than the saturated level (unstable — achieved by slow cooling)
How temperature affects solubility:
For solids in water: Solubility generally increases with temperature. Potassium nitrate () solubility goes from ~13 g/100 g at 0 °C to ~247 g/100 g at 100 °C — a 19× increase.
For gases in water: Solubility decreases with temperature. CO₂ is 0.169 g/100 g at 0 °C but only 0.058 g/100 g at 40 °C. This is why:
- Warm soda loses its fizz quickly
- Dissolved oxygen in rivers decreases in summer — harming fish
- Carbonated drinks are kept cold
Activity 5.2 — Reading a Solubility Curve
Imagine two unknown solids — call them compound A and compound B. We dissolve each in water at different temperatures and plot the results. The graph above is exactly that — a solubility curve. The x-axis shows the temperature in °C, and the y-axis shows how many grams of the solid can dissolve in 100 g of water at that temperature.
Now look closely at the two lines.
- Compound A has a line that rises only a little as temperature goes up. From cold water to hot water, its solubility barely changes.
- Compound B has a line that climbs steeply. In cold water it dissolves only a little, but in hot water it dissolves a lot more.
What does this tell us? Different substances respond very differently to temperature. Some are not too bothered — A keeps a similar solubility throughout. Others, like B, are extremely sensitive — heat opens the door, cold slams it shut. This single idea is going to be the basis of one of the cleanest separation techniques in chemistry, called crystallisation, which you will meet on the very next page.
Where You See This Every Day
Solubility and temperature interact in ways that shape industries and everyday experience:
- Carbonated Drinks Go Flat in Summer — CO₂ dissolves in cold water under pressure. When the bottle warms up (or is opened), CO₂ becomes less soluble and escapes as bubbles. Refrigerated drinks stay fizzy longer.
- Rock Candy (Misri) — Made by creating a supersaturated sugar solution (dissolve maximum sugar in very hot water), then cooling it slowly around a string. Sugar crystallises out as it becomes less soluble at lower temperature. This is crystallisation driven by solubility change.
- Fish Kills in Summer — Fish breathe dissolved oxygen (O₂). In warm summer water, O₂ solubility drops. Shallow ponds and lakes can become hypoxic, causing mass fish death — an environmental consequence of the gas solubility-temperature relationship.
- Stalactites and Stalagmites — CaCO₃ (limestone) is slightly more soluble in cold, CO₂-rich water. As groundwater loses CO₂ in cave air, CaCO₃ becomes supersaturated and precipitates, forming stalactites over thousands of years.